Behind-the-meter and private-wire origination · Great Britain
Power that's already built, and already being paid to switch off.
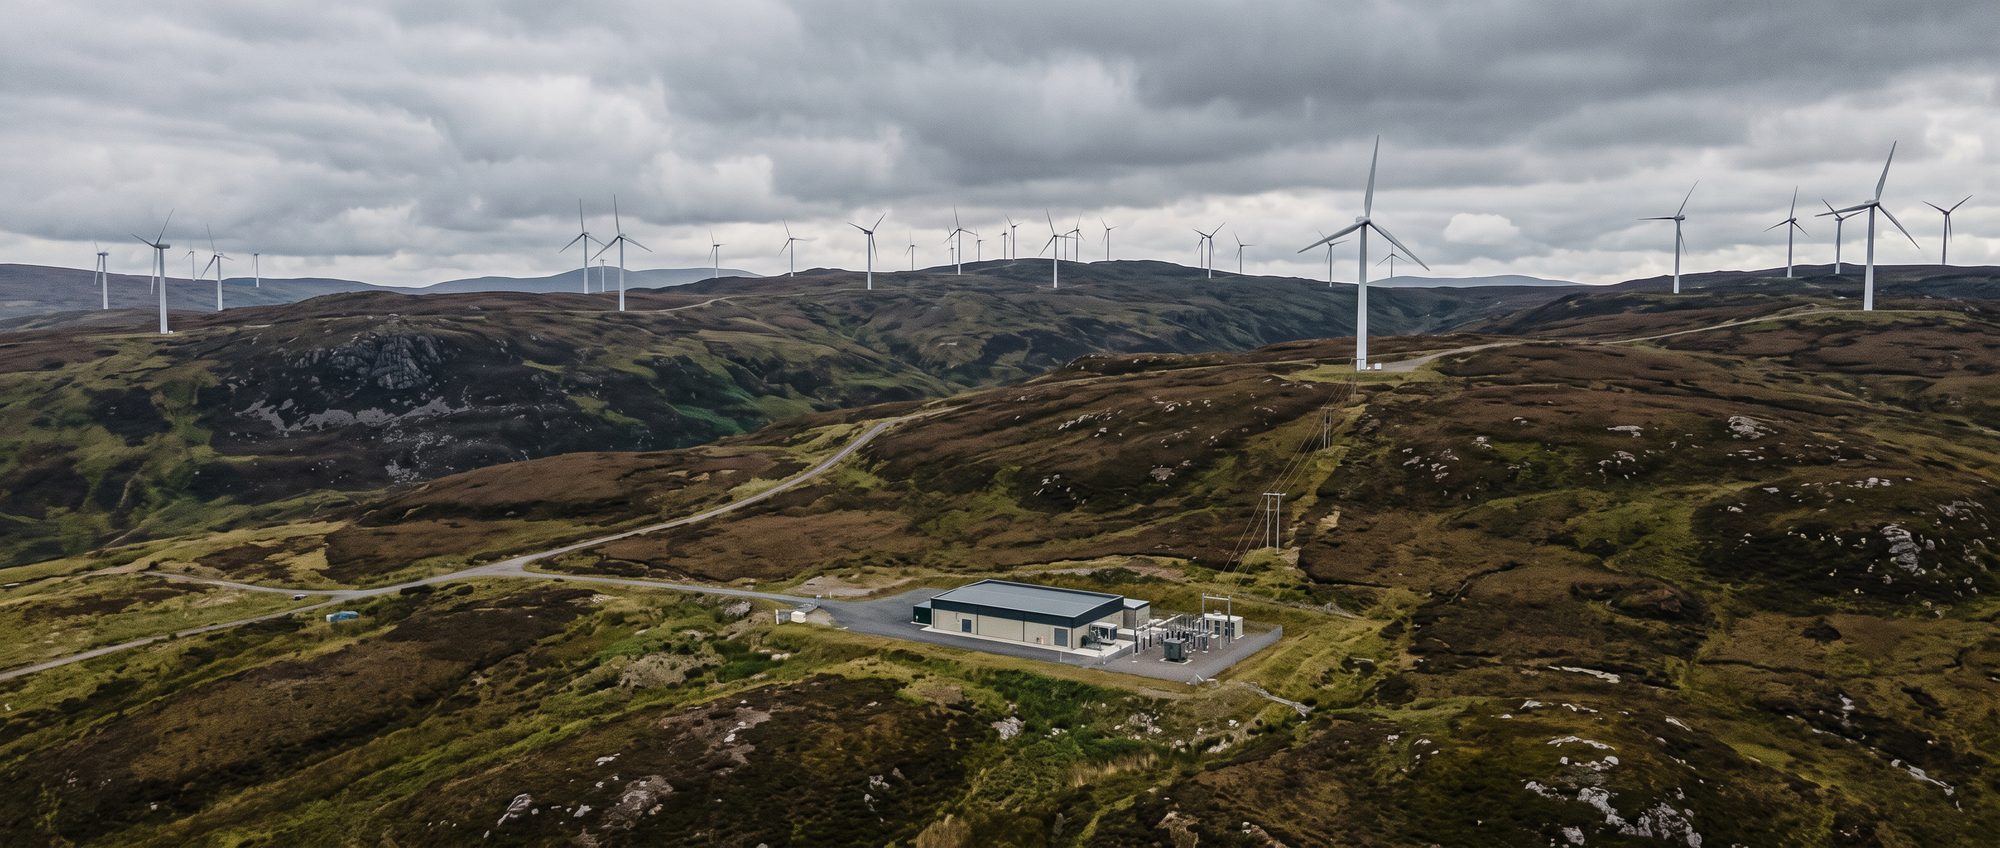
Britain curtailed 10.98 TWh of wind in 2025/26 because the grid couldn't carry it south — and paid the generators to stop. Meanwhile data centres, electrolysers and industrial sites are quoted connection dates in the 2030s. We put the two together: the generator sells power it would otherwise waste; the load gets electricity without a grid queue.
The problem
Two queues, pointing at each other.
Generators north of the constraint boundaries have more power than the wires can take. Loads everywhere have more demand than the connections process can offer. The grid queue reform sorted 722 GW of applications into gates — and still left new demand facing 2030s dates. Private wire is the one route that doesn't wait.
Curtailed generators
134 wind farms received accepted turn-down bids in 2025/26; 79% of the volume is in Scotland, behind the B6 and B4 boundaries. A key boundary drops below 30% of capacity from September 2026 until at least 2027. These assets have land, planning, an operator and a connection — everything except a buyer for the power they can't export.
Loads that can't wait
Contracted demand connections jumped from 41 GW to 125 GW in seven months, driven by data centres. Around 13 GW can connect before 2030. Everyone else is being offered dates after it. Hydrogen electrolysers, HPC and AI compute, cold storage, industrial heat and EV depots all need power now and can tolerate variability better than the grid assumes.
Nobody is doing the matching
Generators don't develop data centres. Data-centre developers don't read the Balancing Mechanism. Land agents don't know constraint boundaries. The information to pair a curtailed farm with a suitable load is public, fragmented and unread. We read it.
The Stranded Power Index
Every curtailed wind farm in Great Britain, ranked.
Accepted negative bids per Balancing Mechanism unit, aggregated by site and matched to the Renewable Energy Planning Database for operator, capacity and location. 118 of 134 sites geolocated. Volumes are MWh; percentages are curtailed energy as a share of theoretical output at a 40% (onshore) or 50% (offshore) load factor.
| # | Site | Type | Operator | MW | Curtailed 2025/26 (MWh) | % of output | 2026/27 YTD (MWh) | Days curtailed | Est. turn-down cost |
|---|---|---|---|---|---|---|---|---|---|
| 1 | Seagreen | Offshore | SSE / Seagreen Wind Energy Ltd | 1,075 | 2,896,200 | 62% | 1,030,562 | 286 | £75.3m |
| 2 | Moray Firth Eastern | — | — | — | 1,932,521 | — | 752,054 | 268 | £50.2m |
| 3 | Moray West | Offshore | EDPR | 882 | 1,598,282 | 41% | 625,926 | 257 | £41.6m |
| 4 | Viking | Onshore | Viking Energy Wind Farm | 443 | 1,223,086 | 79% | 322,493 | 279 | £31.8m |
| 5 | Dorenell | Onshore | EDF Energy Renewables/ Infinergy | 177 | 270,894 | 44% | 70,170 | 213 | £7.0m |
| 6 | South Kyle | Onshore | Vattenfall | 240 | 206,450 | 24% | 59,748 | 158 | £5.4m |
| 7 | Limekiln | Onshore | Boralex/Infinergy | 80 | 164,895 | 59% | 57,458 | 173 | £4.3m |
| 8 | Gordonbush | Onshore | Scottish and Southern Energy (SSE) | 70 | 148,834 | 61% | 43,196 | 281 | £3.9m |
| 9 | Stronelairg | Onshore | Scottish and Southern Energy (SSE) | 228 | 145,722 | 18% | 68,711 | 94 | £3.8m |
| 10 | Bhlaraidh | Onshore | Scottish and Southern Energy (SSE) | 110 | 98,424 | 26% | 21,841 | 138 | £2.6m |
| 11 | Creag Riabhach | Onshore | ERG | 92 | 88,736 | 27% | 22,668 | 168 | £2.3m |
| 12 | Halsary Forest | Onshore | Scottish Power Renewables | 34 | 85,005 | 71% | 25,019 | 276 | £2.2m |
| 13 | Glen Kyllachy | Onshore | Greencoat UK Wind | 48 | 82,895 | 49% | 25,574 | 204 | £2.2m |
| 14 | Beinn an Tuirc | Onshore | CRE Energy/ Scottish Power | 30 | 73,206 | 70% | 31,932 | 195 | £1.9m |
| 15 | Whitelee | Onshore | CRE Energy/ Scottish Power | 322 | 72,956 | 6% | 33,992 | 54 | £1.9m |
| 16 | Kilgallioch (Arecleoch Phase 2) | Onshore | Scottish Power Renewables | 359 | 70,816 | 6% | 37,156 | 76 | £1.8m |
| 17 | Dunmaglass | Onshore | Scottish and Southern Energy (SSE) | 94 | 66,429 | 20% | 12,494 | 105 | £1.7m |
| 18 | Aikengall | Onshore | Community Wind Power | 48 | 64,594 | 38% | 21,566 | 103 | £1.7m |
| 19 | Hornsea B | — | — | — | 61,806 | — | 78,246 | 73 | £1.6m |
| 20 | Neart Na Gaoithe | Offshore | EDF Renewables Power | 450 | 58,774 | 3% | 93,162 | 55 | £1.5m |
| 21 | Strathy North | Onshore | Scottish and Southern Energy (SSE) | 68 | 56,801 | 24% | 15,543 | 127 | £1.5m |
| 22 | Kype Muir | Onshore | Banks Renewables | 88 | 56,754 | 18% | 35,178 | 138 | £1.5m |
| 23 | Sandy Knowe | Onshore | ERG | 82 | 56,414 | 20% | 24,202 | 122 | £1.5m |
| 24 | Greater Gabbard | Offshore | Airtricity / Fluor Ltd | 504 | 56,254 | 2% | 1,470 | 98 | £1.5m |
| 25 | Corriegarth | Onshore | Greencoat Capital | 70 | 48,441 | 20% | 9,098 | 115 | £1.3m |
| 26 | Crystal Rig | Onshore | Fred Olsen Renewables | 235 | 48,026 | 6% | 9,840 | 97 | £1.2m |
| 27 | Windy Rig | Onshore | Statkraft UK | 43 | 47,560 | 32% | 18,012 | 152 | £1.2m |
| 28 | Tom Nan Clach | Onshore | Infinergy | 39 | 46,711 | 34% | 20,410 | 115 | £1.2m |
| 29 | Baillie | Onshore | Baillie Windfarm Ltd | 52 | 45,843 | 25% | 10,414 | 145 | £1.2m |
| 30 | Cumberhead (Revised) | Onshore | Octopus Renewables Infrastructure Trus | 48 | 42,118 | 25% | 16,311 | 145 | £1.1m |
| 31 | Corriemoillie | Onshore | EDF Energy Renewables | 54 | 41,508 | 22% | 6,900 | 125 | £1.1m |
| 32 | Fallago Rig | Onshore | EDF Energy Renewables | 144 | 38,549 | 8% | 13,972 | 64 | £1.0m |
| 33 | Twentyshilling Hill | — | — | — | 37,954 | — | 12,121 | 156 | £1.0m |
| 34 | Kennoxhead | — | — | — | 37,847 | — | 20,084 | 133 | £1.0m |
| 35 | Dersalloch | Onshore | Scottish Power Renewables | 69 | 36,873 | 15% | 11,804 | 116 | £1.0m |
| 36 | Cairn Uish 2 (Rothes 2) | — | — | — | 36,339 | — | 5,934 | 120 | £0.9m |
| 37 | North Kyle | — | — | — | 36,102 | — | 76,954 | 23 | £0.9m |
| 38 | Black Law | Onshore | Scottish Power Renewables | 124 | 34,894 | 8% | 12,392 | 78 | £0.9m |
| 39 | Pauls Hill | Onshore | Fred Olsen Renewables | 65 | 32,317 | 14% | 1,850 | 67 | £0.8m |
| 40 | Crossdykes | Onshore | Muirhall Energy | 48 | 30,072 | 18% | 10,758 | 120 | £0.8m |
| 41 | Greengairs East | Onshore | Muirhall Energy | 24 | 29,724 | 35% | 11,266 | 116 | £0.8m |
| 42 | Douglas West | Onshore | Greencoat (formerly 3R Energy/Blue Ene | 45 | 29,022 | 18% | 13,815 | 132 | £0.8m |
| 43 | Beatrice | Offshore | Scottish & Southern Energy (SSE) / Rep | 588 | 28,456 | 1% | 29,836 | 17 | £0.7m |
| 44 | Griffin | Onshore | Greenpower (Griffin) Ltd | 156 | 28,278 | 5% | 16,468 | 43 | £0.7m |
| 45 | Kilbraur | Onshore | Renewable Development Company (RDC) | 48 | 27,621 | 17% | 1,474 | 85 | £0.7m |
| 46 | Lochluichart | Onshore | Eneco | 51 | 27,096 | 15% | 7,658 | 68 | £0.7m |
| 47 | Cairn Uish 1 (Rothes 1) | — | — | — | 26,719 | — | 3,846 | 82 | £0.7m |
| 48 | Farr | Onshore | Innogy (formerly RWE npower) | 92 | 25,587 | 8% | 4,218 | 57 | £0.7m |
| 49 | Brockloch Rig | — | — | — | 22,815 | — | 10,644 | 80 | £0.6m |
| 50 | Benbrack | Onshore | E.ON Renewables / Red Rock Power Limit | 67 | 22,112 | 9% | 14,238 | 42 | £0.6m |
Showing the top 50 of 134. Full dataset (CSV, all sites, three years) available to engaged clients. Offshore farms are listed because their onshore substations and cable landfalls are where a co-located load sits. Sites marked — could not be matched to a REPD record automatically and are pending manual verification.
Who we work with
Both sides of the wire.
Generators and asset owners
You are paid to switch off. A behind-the-meter offtaker pays you to stay on — at a price above your turn-down bid and below the load's grid alternative. We find and qualify the load, model the co-location, and bring you a counterparty ready for heads of terms.
- Constraint profile: when, how often, how much you are curtailed, from your own BM data
- Land and planning envelope around your substation and cable route
- Qualified offtaker introductions — data centre, electrolyser, industrial — with credit and timeline checked
- PPA and private-wire structure options; interaction with your CfD or ROC position
Loads that can't wait for the grid
You have been quoted a connection date you can't build a business around. A curtailed generator has the opposite problem. We identify the sites where your load profile, footprint and latency or logistics needs fit a specific generator's surplus — and introduce you.
- Site shortlist: curtailed generators with land, access, fibre proximity and planning context
- Surplus profile matched to your load: hours, seasonality, firmness, storage or grid top-up required
- Indicative delivered cost versus your grid-connected alternative
- Introductions to the asset owner and landowner; support through to heads of terms
Who this is not for. Loads that need firm 24/7 power with no storage and no grid backup — a curtailed wind farm is a variable resource, and we won't pretend otherwise. Flexible, interruptible or storage-backed loads are where the economics work: electrolysis, batch compute, cold storage, thermal storage, EV charging depots, and data centres designed for it.
How we work
Fixed-fee analysis. Success-fee introductions.
We are an origination and analysis practice, not a developer and not a broker on retainer. You pay a fixed fee for work with a defined output, and a success fee only when a match reaches signed heads of terms.
Constraint & Co-location Assessment
For one generator or one load. Three years of curtailment or demand profile, land and planning envelope, grid and boundary context, a ranked list of counterparties, and an indicative economics range. Delivered in 15 working days.
Match Pack
For a specific pairing. Hourly surplus-versus-load model, delivered-cost comparison against the grid alternative, structure options (private wire, sleeved PPA, co-location lease), risk register, and a heads-of-terms skeleton both sides can work from.
Introduction & heads of terms
We bring the counterparty, run the first conversations, and support both sides to signed heads of terms. Fee payable on signature, credited against any fixed-fee work in the preceding twelve months.
Index subscription
Monthly refresh of the full Stranded Power Index — every curtailed site, three years of volumes, REPD attributes, boundary tagging, and new-entrant alerts — as CSV and API. For developers, investors and advisers who want the data without the service.
Method and sources
Public data, read properly.
Curtailment volumes are accepted negative bids from NESO's Wind BMU BOA Volumes dataset, published per Balancing Mechanism unit and half-hour settlement period. NESO publishes MW per half-hour; we convert to MWh and aggregate units to sites. Site attributes — operator, capacity, technology, planning authority and grid reference — come from DESNZ's Renewable Energy Planning Database (Q2 2026 extract), matched by name and verified by hand for the top 50. Grid references are converted from OSGB36 to WGS84 for mapping.
Cost estimates use the 2026 year-to-date average accepted turn-down price of £26/MWh reported from Elexon data; they exclude the larger cost of replacement generation. Load-factor assumptions of 40% onshore and 50% offshore are used only to express curtailment as a share of theoretical output.
What the Index does not yet cover. Solar and distribution-connected wind curtailed under Active Network Management schemes do not appear in the Balancing Mechanism; we are adding DNO flexible-connection data. Offshore sites are shown at their REPD reference point, not their onshore substation. Seven sites await manual REPD matching.
Who's behind it
Ten years in wind, solar and edge data centres.
Stranded Power is run by a renewables operator who has sat on both sides of this table — developing generation, and building the edge data-centre infrastructure that now needs power the grid can't offer. Before that, twenty years placing chief executives in the biopharmaceutical industry, which is where the habit of reading everything before recommending anything comes from.
Questions
What people ask first.
Doesn't a private-wire load just take the generator out of its CfD or ROC?
It changes the position and has to be modelled, not assumed. Power consumed behind the meter is not exported, so it doesn't earn the export-linked support — but the generator is currently earning a turn-down payment on that power, not its strike price. The comparison that matters is turn-down payment versus private-wire price, hour by hour, which is exactly what the Match Pack models. Some structures keep the grid connection for the un-curtailed hours and route only the surplus behind the meter.
Curtailed power is intermittent. What load runs on that?
Flexible or storage-backed ones. Electrolysis, batch and AI training compute, cold storage, thermal stores, EV depots. A curtailed Scottish wind farm is turned down on 150–290 days a year, typically for many hours at a stretch. A load designed to follow that — with a small grid connection or battery for the rest — gets very cheap energy. A load that needs firm 24/7 power does not belong here, and we'll say so in the first conversation.
Will grid upgrades make this go away?
Eventually, partly. Government projections have constraint costs peaking around £7bn a year near 2030 before new transmission relieves the Scottish boundaries in the early 2030s. That is a five-to-seven-year window in which the surplus is real, growing, and paid to disappear — long enough to build and amortise a co-located load, and the generator keeps the load after the constraint eases.
Why not just ask NESO or the DNO?
They publish the data — that's how we built the Index — but they don't originate deals. Behind-the-meter arrangements sit outside the connections process by design. The matching, the modelling and the introductions are commercial work that no network operator does.
Are you a developer or an agent?
Neither. We don't take positions in sites, we don't hold options, and we don't act for one side against the other. We are paid fixed fees for analysis and a success fee when a match signs. Any relationship with a listed party is disclosed before we introduce it.
Start here
If you're being paid to switch off, or being told to wait until 2032 — talk to us.
A first conversation costs nothing. Tell us which side of the wire you're on and we'll tell you, honestly, whether there's a match worth modelling.